Cost visibility is the first step to managing and forecasting cloud costs. But before you splurge on a Kubernetes cost monitoring solution, make sure that it includes these three crucial metrics.
Picking the right cost monitoring areas to focus on makes a difference in how you budget for the cloud and investigate cost spikes. Here are three metrics that help teams meet their FinOps goals.
3 cloud cost metrics every team needs to track
1. Daily cloud spend
Are your current cloud costs compatible with your budget? What is your burn rate?
To keep cloud expenses in check, you need to have all the data at hand to easily extrapolate your daily or weekly expenses into your monthly bill. The daily spend report helps to do just that.
Suppose you have a budget of $1,000 per month. You should be able to check whether you’re still running under the budget or at least in line with it. If your average daily spend is closer to $50 than c. $33 (30 days x $33 = $990), you’re likely to end up with a higher cloud bill than expected.
This is an example of the daily spend report from CAST AI, which shows all this data in one place:
Another benefit of the daily cloud costs report is that it allows you to identify outliers in your usage or spend. You can verify how much you’ve spent each day for the last two weeks and double-check that data for any outliers or cost spikes that might lead to cloud waste.
2. Cost per provisioned and requested CPU
Another good practice is tracking your cost per provisioned CPU and requested CPU. Why should you differentiate between these two reports?
By comparing the number of requested vs. provisioned CPUs, you can discover this gap and calculate how much you're actually spending per one requested CPU to make your cost reporting more accurate.
If you’re running a Kubernetes cluster that hasn’t been optimized for cost, you will see a significant difference between how much you're provisioning and how much you're actually requesting. You'll see that you're spending money on provisioned CPUs and only end up requesting only a small amount of them.
Let’s illustrate this with an example:

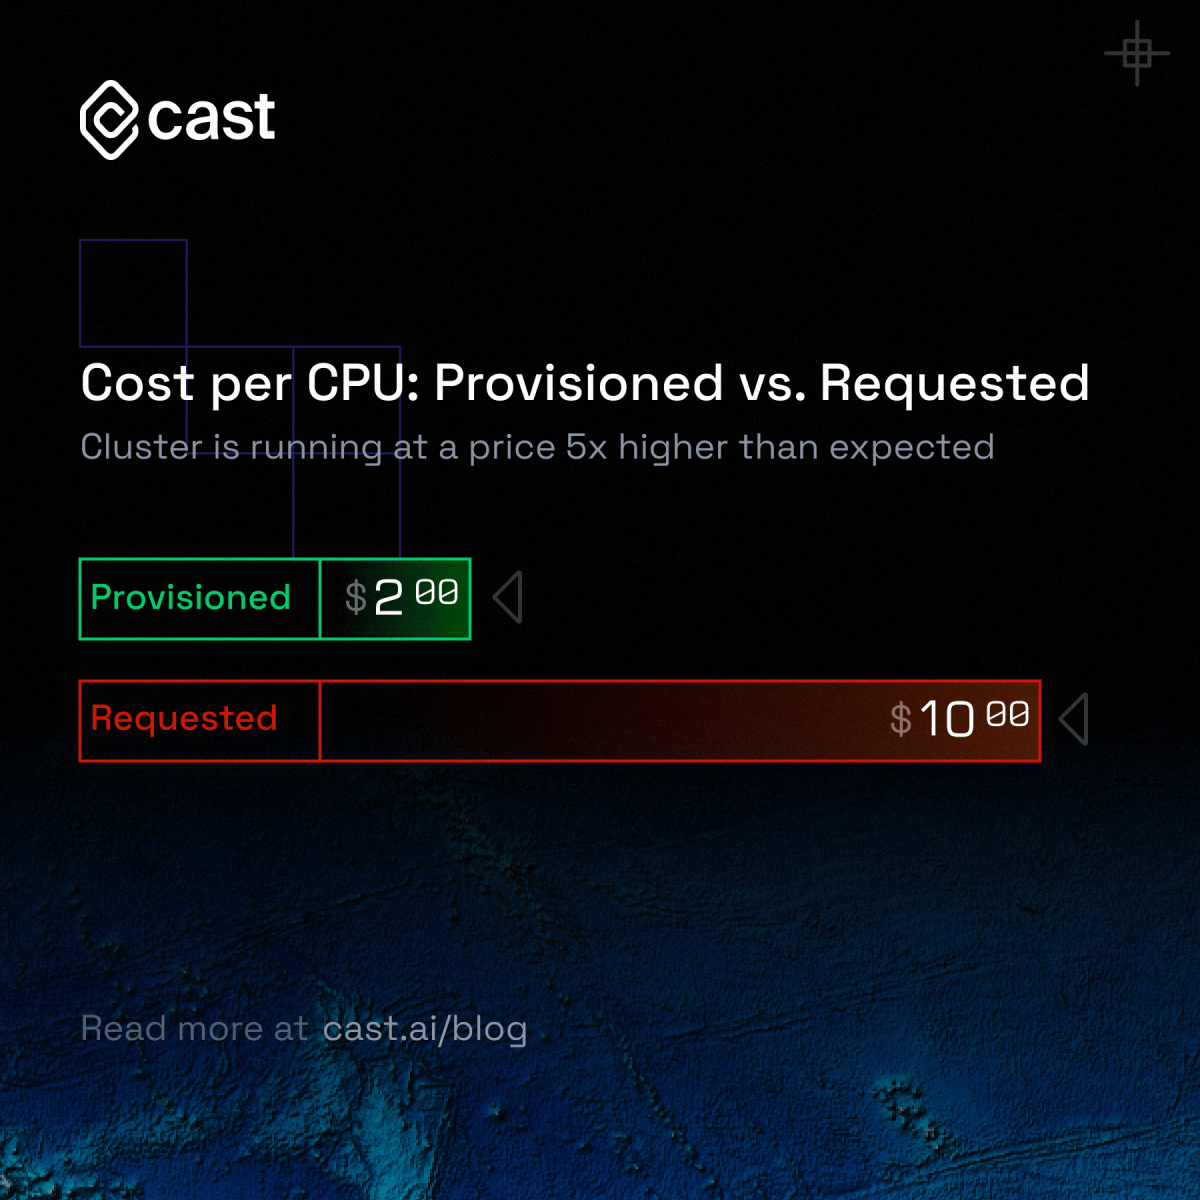
Your cost per provisioned CPU is $2. Due to the lack of optimization, you waste a lot of resources. As a result, your cost per requested CPU is $10. This means that you’re running your cluster for a price that is 5x higher than expected.
3. Historical cost allocation
You’re an engineering manager who got a cloud bill from the FinOps manager asking why the heck it’s so high. You went over budget like most teams that use public cloud services. But what ended up costing you more than expected?
This is where historical cost allocation makes a difference.
This report can save you hours, if not days, on investigating where the extra costs come from. By checking last month's spend dashboard, you can instantly view the cost distribution between namespaces or workloads in terms of dollar spend.
See a couple of workloads running and using a lot of money but not doing anything? These are idle workloads - the prime driver of cloud waste.
You have the solution. Now you know what to clean up and make the financial operations manager happy next month.
Access these three reports for free
The CAST AI Kubernetes cost monitoring module includes all of these three crucial reports and gives you access to heaps of historical cost data free of charge.
Connect your cluster and analyze your cloud costs in real time to never go over budget again.
CAST AI clients save an average of 63% on their Kubernetes bills
Connect your cluster and see your costs in 5 min, no credit card required.

